

While writing application for my Masters Degree diploma I was required to came up with simple library for creating simple 2D graphs in the browser. Today I decided to share it with the rest of the world 🙂
My lib uses HTML5 tag canvas and jQueryUI library, which is used for creating dialogs for every figure.
Using is really simple. All you need to have is some data in four arrays:
XAxis – it’s array with 2 values, start and end of XAxis range. Those values are also drawn as a legend for X values
XData – it’s just array of X values
YAxis – same as XAxis but for Y axis
YData – Y values
It’s important to have same number of items in XData and YData arrays. But it’s common sense anyway 🙂
Those 4 arrays are values of object, figure representation in JS. This object should also have Type property with value ‘line’. This is because I am planning to have unified start point for drawing 2D and 3D graphs. About three dimensional graphs I will post soon.
Object for single figure should look something like this:
{ Type: 'line', XAxis: [0, 1], XData: [...], YAxis: [0, 1], YData: [...]}
This is one figure, but my library can show multiple graphs at once so this figure-data-object must be added to dictionary. Keys from this dictionary will also serve as figure names and canvas ids so this cannot be anything that also is not permitted as DOM element id.
Dictionary with single figure named ‘Test1’ should resemble following example:
{ "Test1": { Type: 'line', XAxis: [0, 1], XData: [...], YAxis: [0, 1], YData: [...]} }
Dictionary with figures data should be send as param to figures figuresDrawer.draw function. And that is all you need to know before start using my library.
As a example I written JavaScript white noise generator 🙂
$(function () {
            YData = [];
            XData = [];
            length = 100;
            for (var i = 0; i < length; i++) {
                YData.push(Math.random());
                XData.push(i / length);
            }
            figuresDrawer.draw({ "Test1": { Type: 'line', XAxis: [0, 1], XData: XData, YAxis: [0, 1], YData: YData} });
        });
As result we will see graph in jQueryUI dialog:
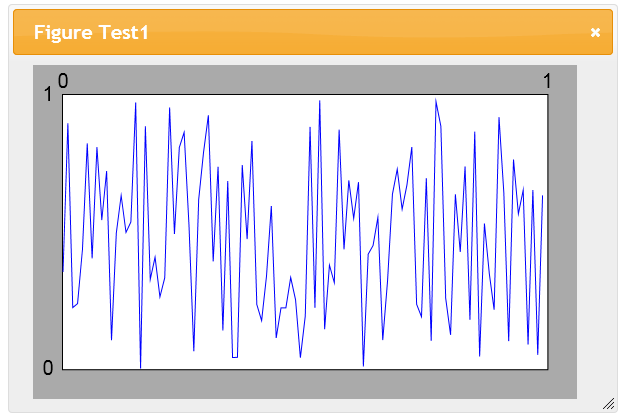
For more configuration of graph you can change values in figuresConfig.js file.
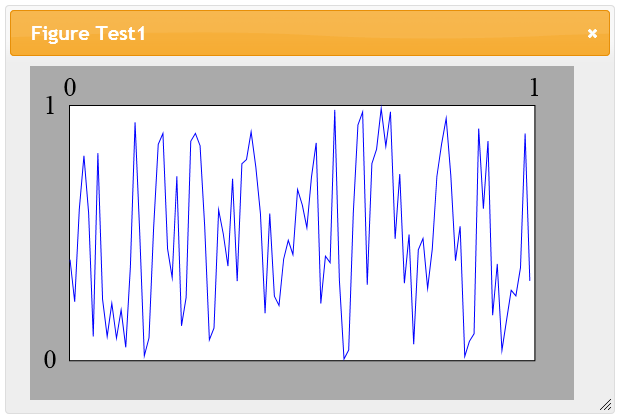
As jQueryUI library allows to resize dialogs, graphs can be resized to. In this config file you can choose default values of width and height of new dialog.
this.default2dHeight = 400;
this.default2dWidth = 600;
partialCanvasId values is just template for graphs canvas tags ids. You can change it, but it has not impact on graphs functionality. I decided to put this here because I needed it in one place for 2D graphs and 3D graphs.
More interesting configuration values are in Figures2d.js file.
__axis_numbers_size – size of font for drawing axes ranges
__axis_numbers_style – here you can change font of those numbers
So changing code to:
var __axis_numbers_size = 20;
var __axis_numbers_style = __axis_numbers_size.toString() + "pt Times New Roman";
will set font to 20p size Times New Roman font.
Next 4 variables are colors of:
__figure_bg_color – background color for axis ranges description; in image above it’s gray strips around graph space itself.
__figure_grid_bg_color – this is background color for graphs space; white color above
__axes_color – it is color of axes lines, color of black rectangle separating gray strips and white graph space, but it is also color of axis numbers
__plot_color – color of plot lines; blue color in example
After changing code:
var __figure_bg_color = "black";
var __figure_grid_bg_color = "gray";
var __axes_color = "White";
var __plot_color = "#FF0000";
we can see black figure background with white axes and red plot lines on gray background.
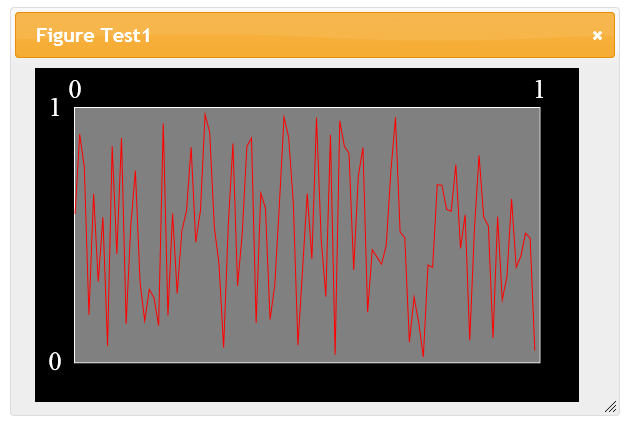
You can change it but I think that default are much nicer 🙂
Another thing that can be worth mentioning is that after resizing graphs are redrawn after some time after resizing. Without it it would looking strange because resizing of drawn canvas tag work like resizing an image. You can try this for example resizing to small window (it will be not readable in that size), and then again to bigger dialog window (when you will see eventually big pixels with lite smooth effect). After 2 seconds graphs will automatically resize itself to stretch to new size.
I understand that there are plenty of better libraries for this, but maybe this one will suit somebody. It’s really simple and lite, less then 300 lines. And without jQueryUI which can be slow sometimes it could be really fast. And it can starting point for someone that would want to write something on their own.