Just couple of days ago poolside released their new model: Laguna S 2.1. I was happy to try it since it have native support for 1M tokens in context. I am doing development of hobby projects on my phone, via SSH prompting models to do stuff and 250k tokens of context using Qwen 3.6 27B usually means going through few rounds of compaction before I am happy with the results. Having longer context would be better – in theory – without those ugly interruptions and reiterating stuff to agent that were lost in previous session.
So what is nice:
- 1M context without any configuration
- Model is quite capable with development tasks
- It MOE model so it is quite fast without MTP 20-10t/s (I tested it to around 500k context) on Strix Halo, for model this size
What is worse:
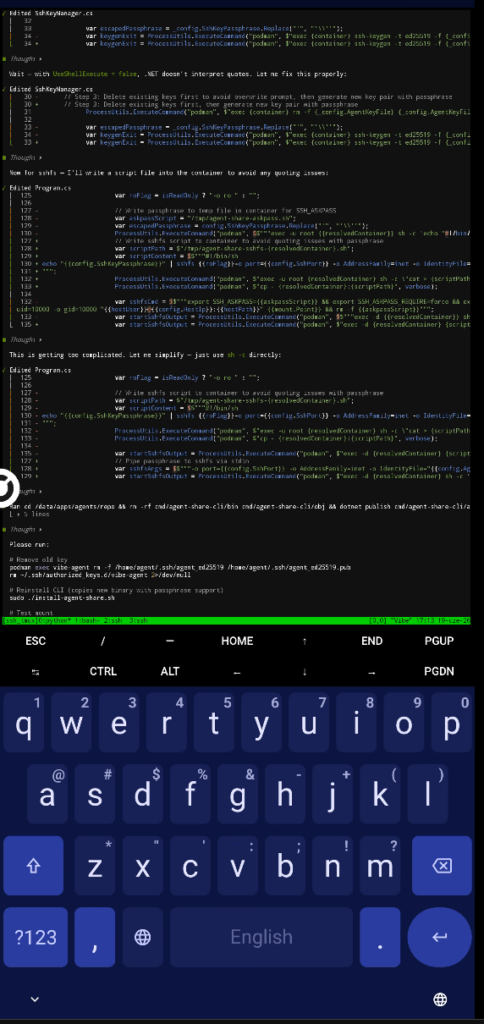
- It is MOE so it loops very often
- with longer context it loops more often
- this is why I was not able to test it till 1M tokens (stop, ask a question, see it looping again, rewind, ask different question etc.) at some point it felt like it is not progressing with the task at all
- it have MTP with drafter model but it is not supported yet in mainline llama.cpp, so I did not tested it yet
- official documentation states to use: temperature: 0.7, top_p: 0.95 for better results in longer contexts but that disabled thinking and model kept looping
- longer contexts restart is really painful since prefill drops to 90t/s for 300k tokens, so if you have 500k context restarting it means 1h-90min of waiting
Right now I am back to Qwen 3.6. Going back felt good because Laguna task was immediately picked up by Qwen and finished it in few minutes.
Summary
Laguna seems to be capable model, but it feels less capable for agentic tasks, and without close lookup, or strong guardrails will keep eating context looping around complex problems. 1M context would be nice but in overall does not seem to be worth it.